Pit and Pendulum Unit 1
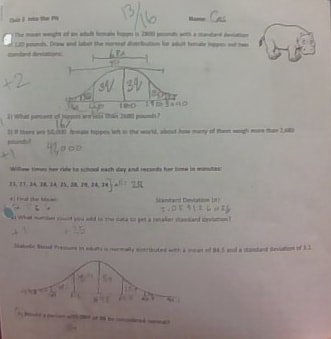
This unit was about a man who was in a pit and a pendulum. the pendulum was slowly moving down and back and forth. In this project we lea This unit was about a man who was in a pit and a pendulum. the pendulum was slowly moving down and back and forth. In this project we learned how to use stranded deviation, curve fitting, and normal distribution. Image illustrating the definition of standard deviation and how to use stranded deviation, curve fitting, and normal distribution. Image illustrating the definition of standard deviation the degree of data dispersion from the mean is indicated by the standard deviation. Image result for standard deviation definition A low standard deviation implies that the data are grouped around the mean. curve fitting is The process of finding a curve that is “a best fit” for given data is called curve fitting. and Normal distribution is a symmetric probability distribution about the mean, demonstrating that data close to the mean occur more frequently than data far from the mean. The way you find the solution is by using all of these but all together. we did an interactive part where we all drop a nut with a protractor and measured the time it took to do a full swing. to get the actual answer to the pendulum project we needed to analyze the data were given and use desmos.
Shadow Project
This Unit was about shadows and finding the length of the shadow with the info that was provided.
We learned about Cosine, Tangent, Sine, and obosite,
We learned about Cosine, Tangent, Sine, and obosite,


